- 16K
Customers
- 3M
Users
In this article
- What is Embedded Analytics?
- Why Does Embedded Analytics Matter Now?
- How Does Embedded Analytics Work?
- Use Cases of Embedded Analytics
- Core Capabilities of Embedded Analytics Platforms
- How to Implement Embedded Analytics?
- What Should I Look for in an Embedded Analytics Partner?
- What Does Embedded Analytics Cost?
- Zoho Analytics for Embedded Analytics
What is Embedded Analytics?
Embedded analytics is the integration of dashboards, reports, KPIs, and data visualizations directly into business applications or systems. It allows people to access and work with data from the same place where business activities already happen.
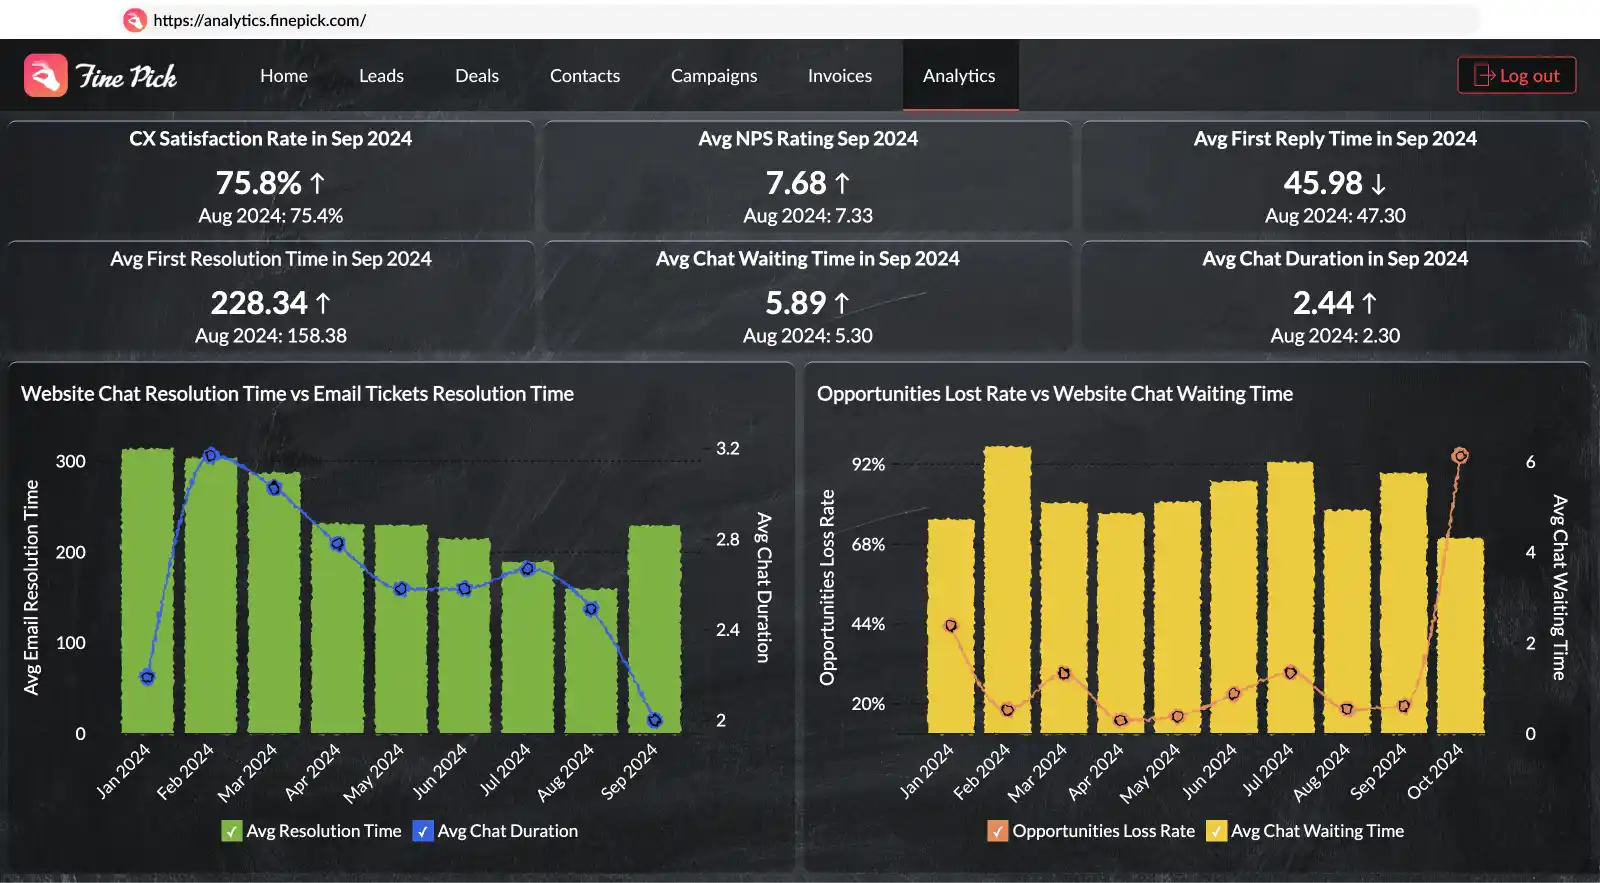
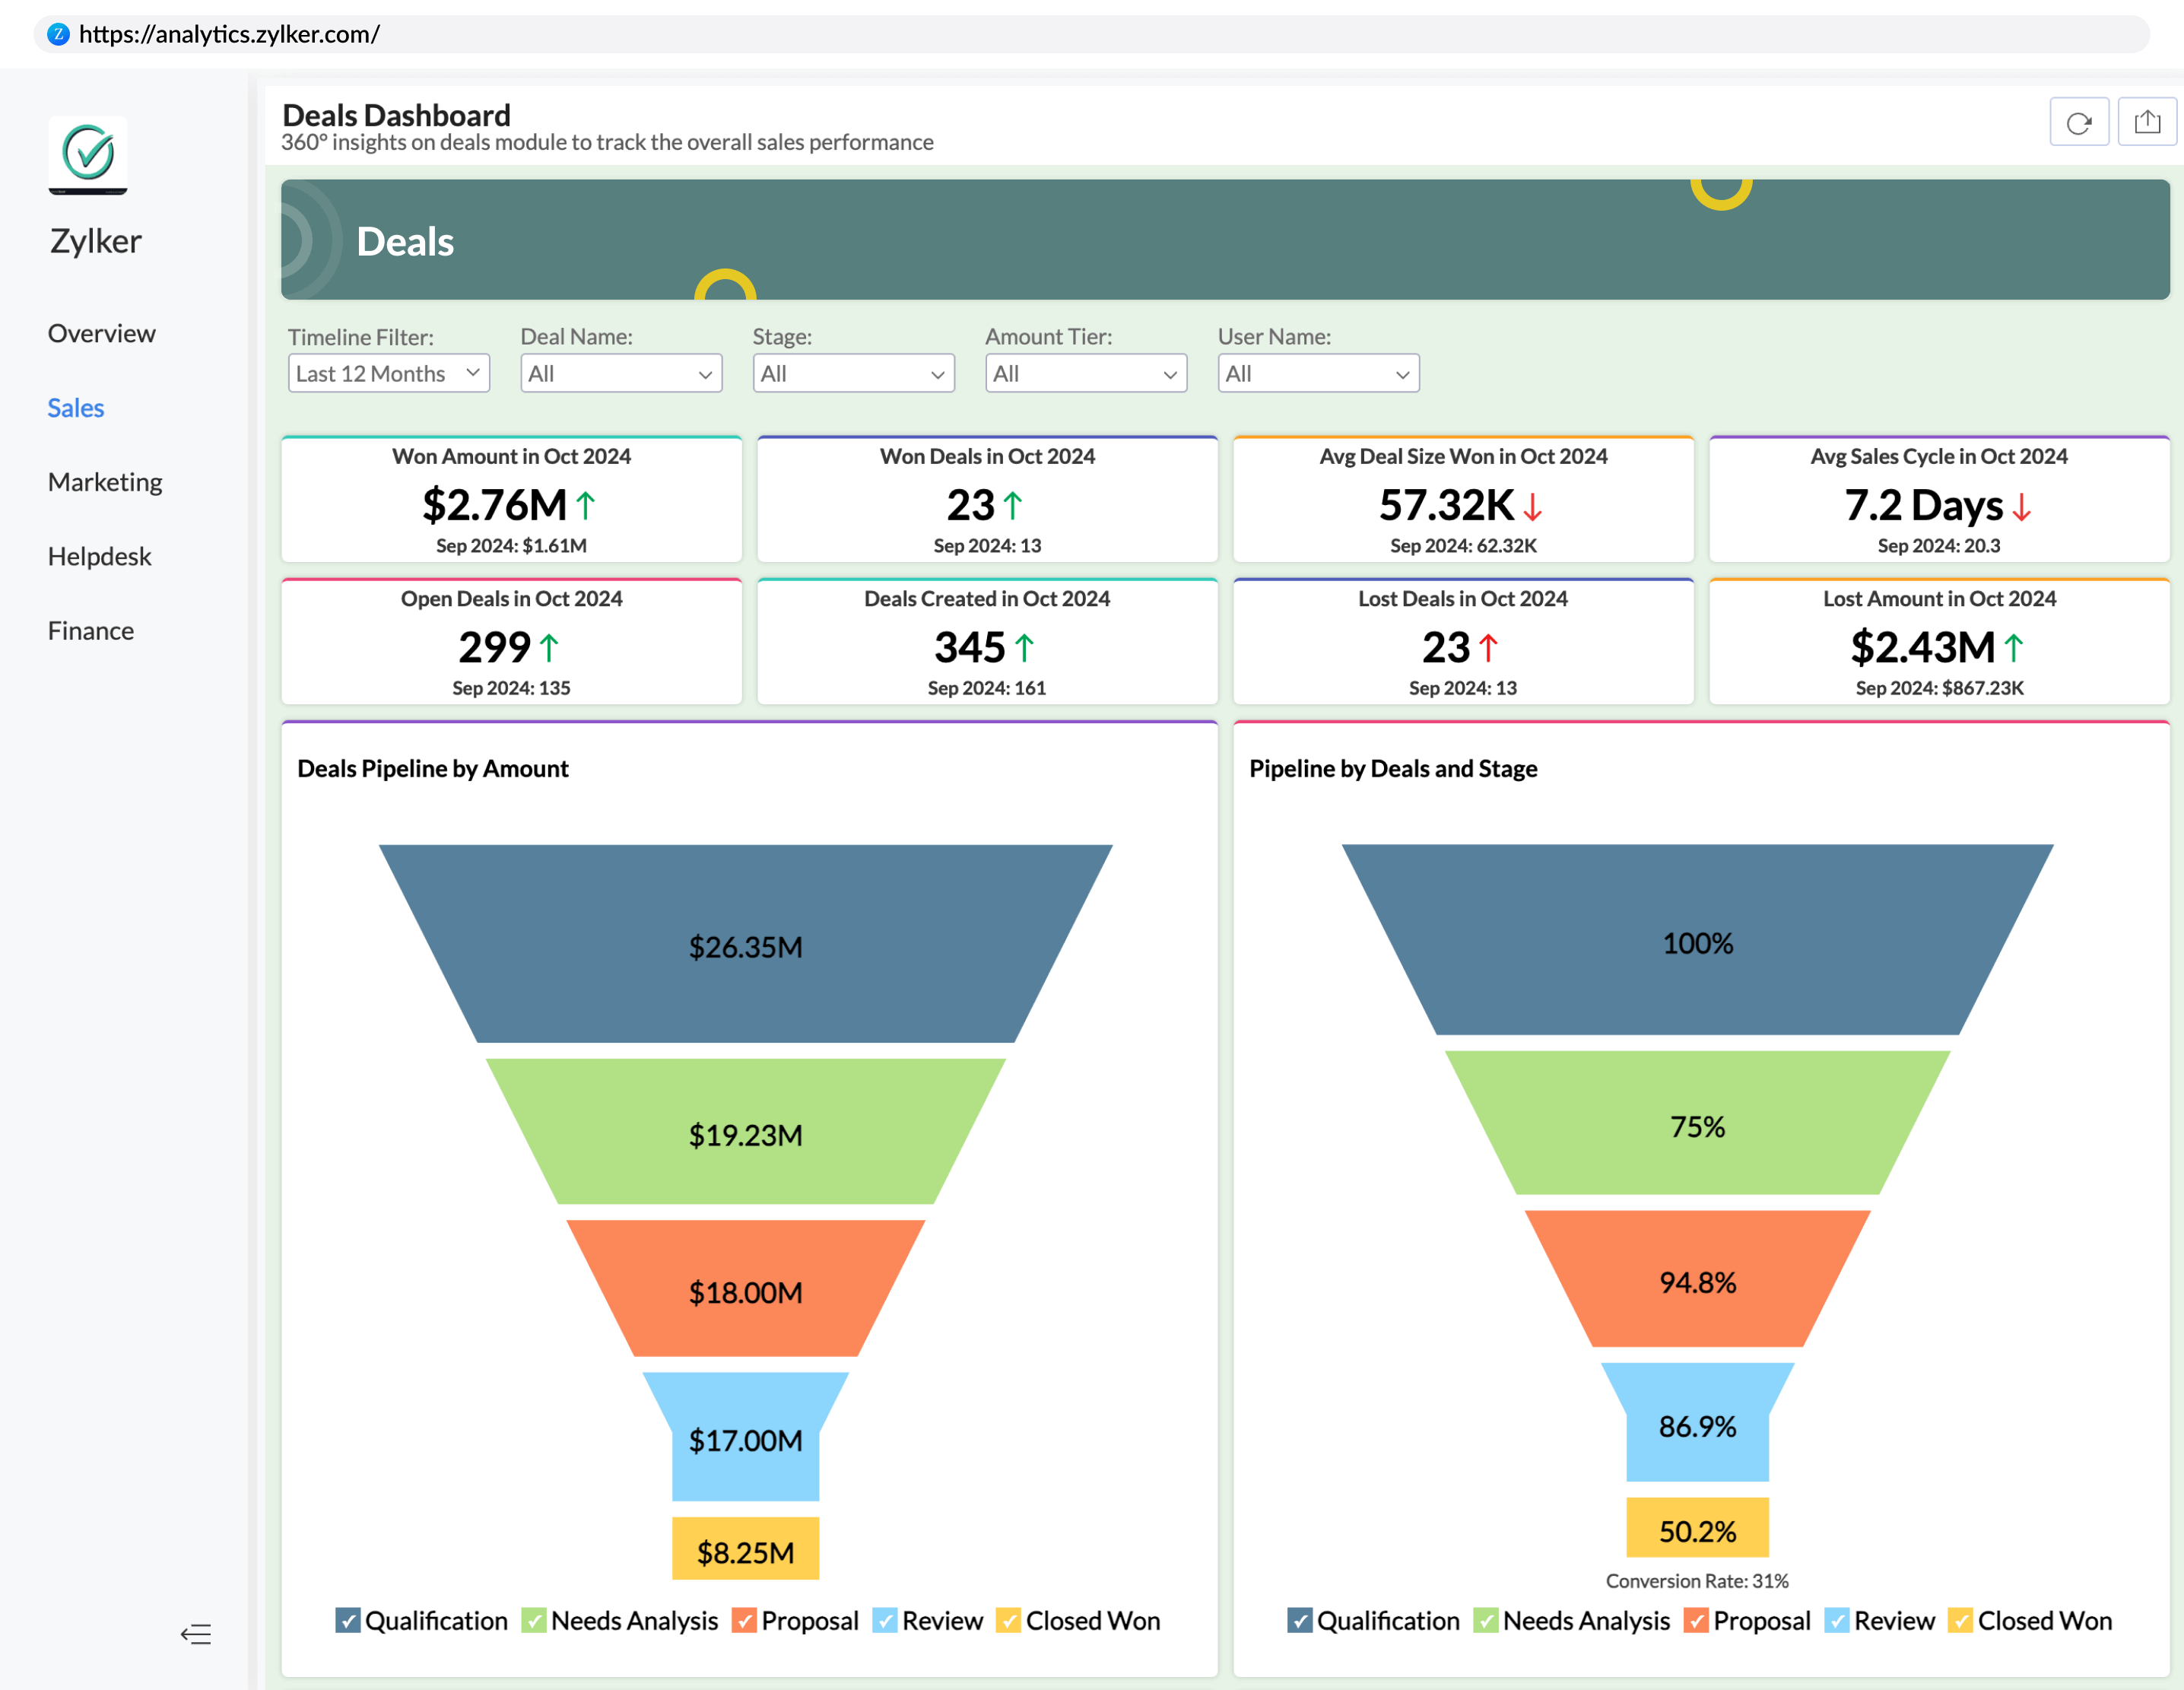
For example, a product manager reviewing pipeline performance inside a CRM, a warehouse operator monitoring output in an ERP system, or a SaaS customer checking account usage inside the product interface are all interacting with embedded analytics.
Reports and dashboards are introduced as part of the application instead of requiring a separate analytics interface. Depending on how the implementation is configured, people may interact with reporting features without noticing that the analytics layer is provided by a separate system.
Embedded analytics differs from traditional business intelligence in where reporting appears. Traditional BI tools operate as separate reporting destinations, while embedded analytics places reporting directly inside the product where work already happens.
Why Does Embedded Analytics Matter Now?
Reporting expectations have expanded across many software categories, especially where teams already work with operational and customer data. Access to reports and business metrics is increasingly treated as part of the product rather than a separate analytics process.
When reports are accessed through a separate analytics tool, teams often need to switch contexts before reviewing information or taking action. Embedded analytics reduces that extra step by placing dashboards and reports inside the existing application.
For software vendors, embedded reporting has become a common product expectation across many categories. Products that include reports directly in the interface can make reporting easier to access and support customer-facing reporting scenarios. To support this model, embedded analytics relies on a combination of data preparation, report generation, and application-level integration.
How Does Embedded Analytics Work?
Embedded analytics connects reports with the applications where people already work and access business information. Behind that process are several stages that prepare data, organize it for analysis, and make dashboards available inside the product.
Data collection
Business data is collected from sources such as CRMs, ERPs, databases, spreadsheets, and cloud applications. Depending on the reporting use case, this may include sales activity, customer metrics, operational records, or application data.

Data preparation and modeling
Collected data is prepared through transformation steps such as joins, aggregations, calculated fields, and business rules. Organizations then create data models that reflect how they measure performance and organize information.

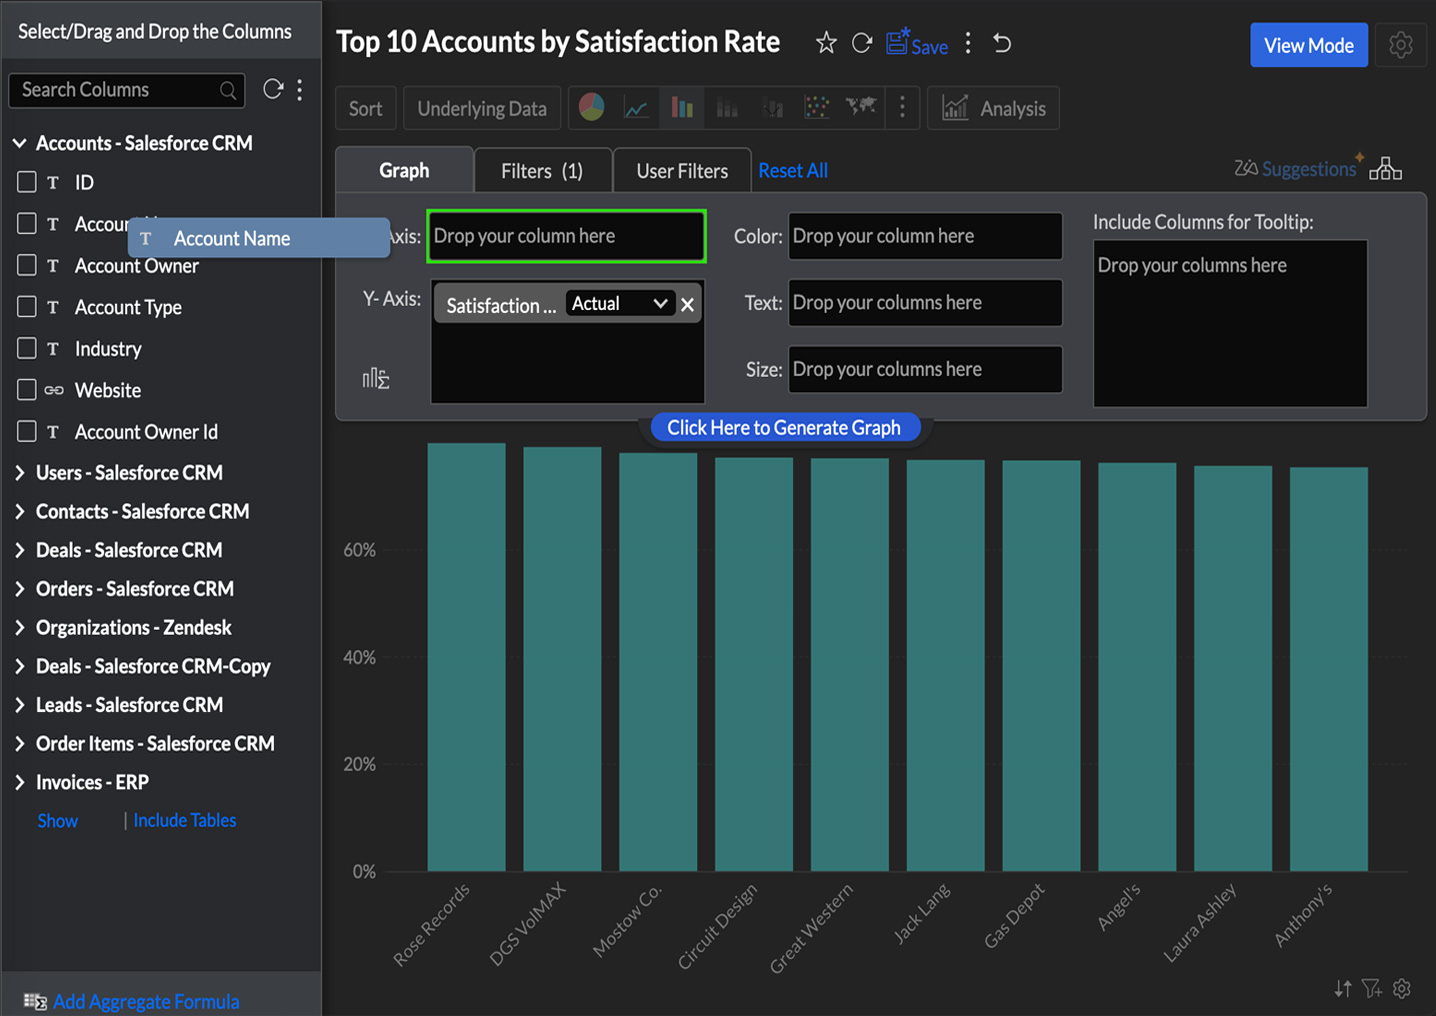
Report creation and visualization
Prepared data is converted into reports, KPI widgets, charts, pivot tables, and dashboards. Filters, drill-down paths, and report controls allow people to examine data without switching to a separate reporting tool.
Embedding and access configuration
Reports and dashboards are introduced into the application through APIs. Zoho Analytics supports configuration options including white-labeling, SSO, role-based access control, and multi-tenant deployment so reporting remains connected to the application and follows existing access settings.
Use Cases of Embedded Analytics
Organizations introduce analytics differently depending on product type, operating model, and the type of information people need to review.
ERP Platforms
ERP systems collect operational data across finance, HR, operations, and sales. Reporting inside ERP interfaces helps teams review KPIs and operational performance without moving data into separate spreadsheets or reporting tools. (Learn more about embedded analytics for sales within ERP contexts).
SaaS Applications
SaaS products often include reporting directly inside the product interface so customers can review usage, monitor performance, and work with their own data without leaving the application. Embedded reporting can also support packaged reporting tiers and customer-facing analytics experiences. (Learn more about embedded analytics for SaaS)
Custom Internal Platforms
Internal business systems often support operational processes that depend on frequent reporting. Introducing dashboards directly into these platforms allows teams and managers to review information from the same interface where day-to-day work already happens and reduces dependence on centralized reporting requests. (Know more on embedded analytics for fintech)

Core Capabilities of Embedded Analytics Platforms
While implementation patterns vary across products, the underlying capabilities that support embedded analytics remain broadly similar. Embedded analytics platforms vary in how they manage data, present reports, and fit into existing products. The capabilities below influence how reports are prepared, delivered, and maintained over time.
Data Preparation
Embedded analytics depends on data that is prepared before reports are created. Platforms should support connections across multiple data sources and provide tools for transformation, modeling, and preparation before reports are created. Prepared data gives reports consistent inputs and reduces issues caused by incomplete or mismatched source systems.
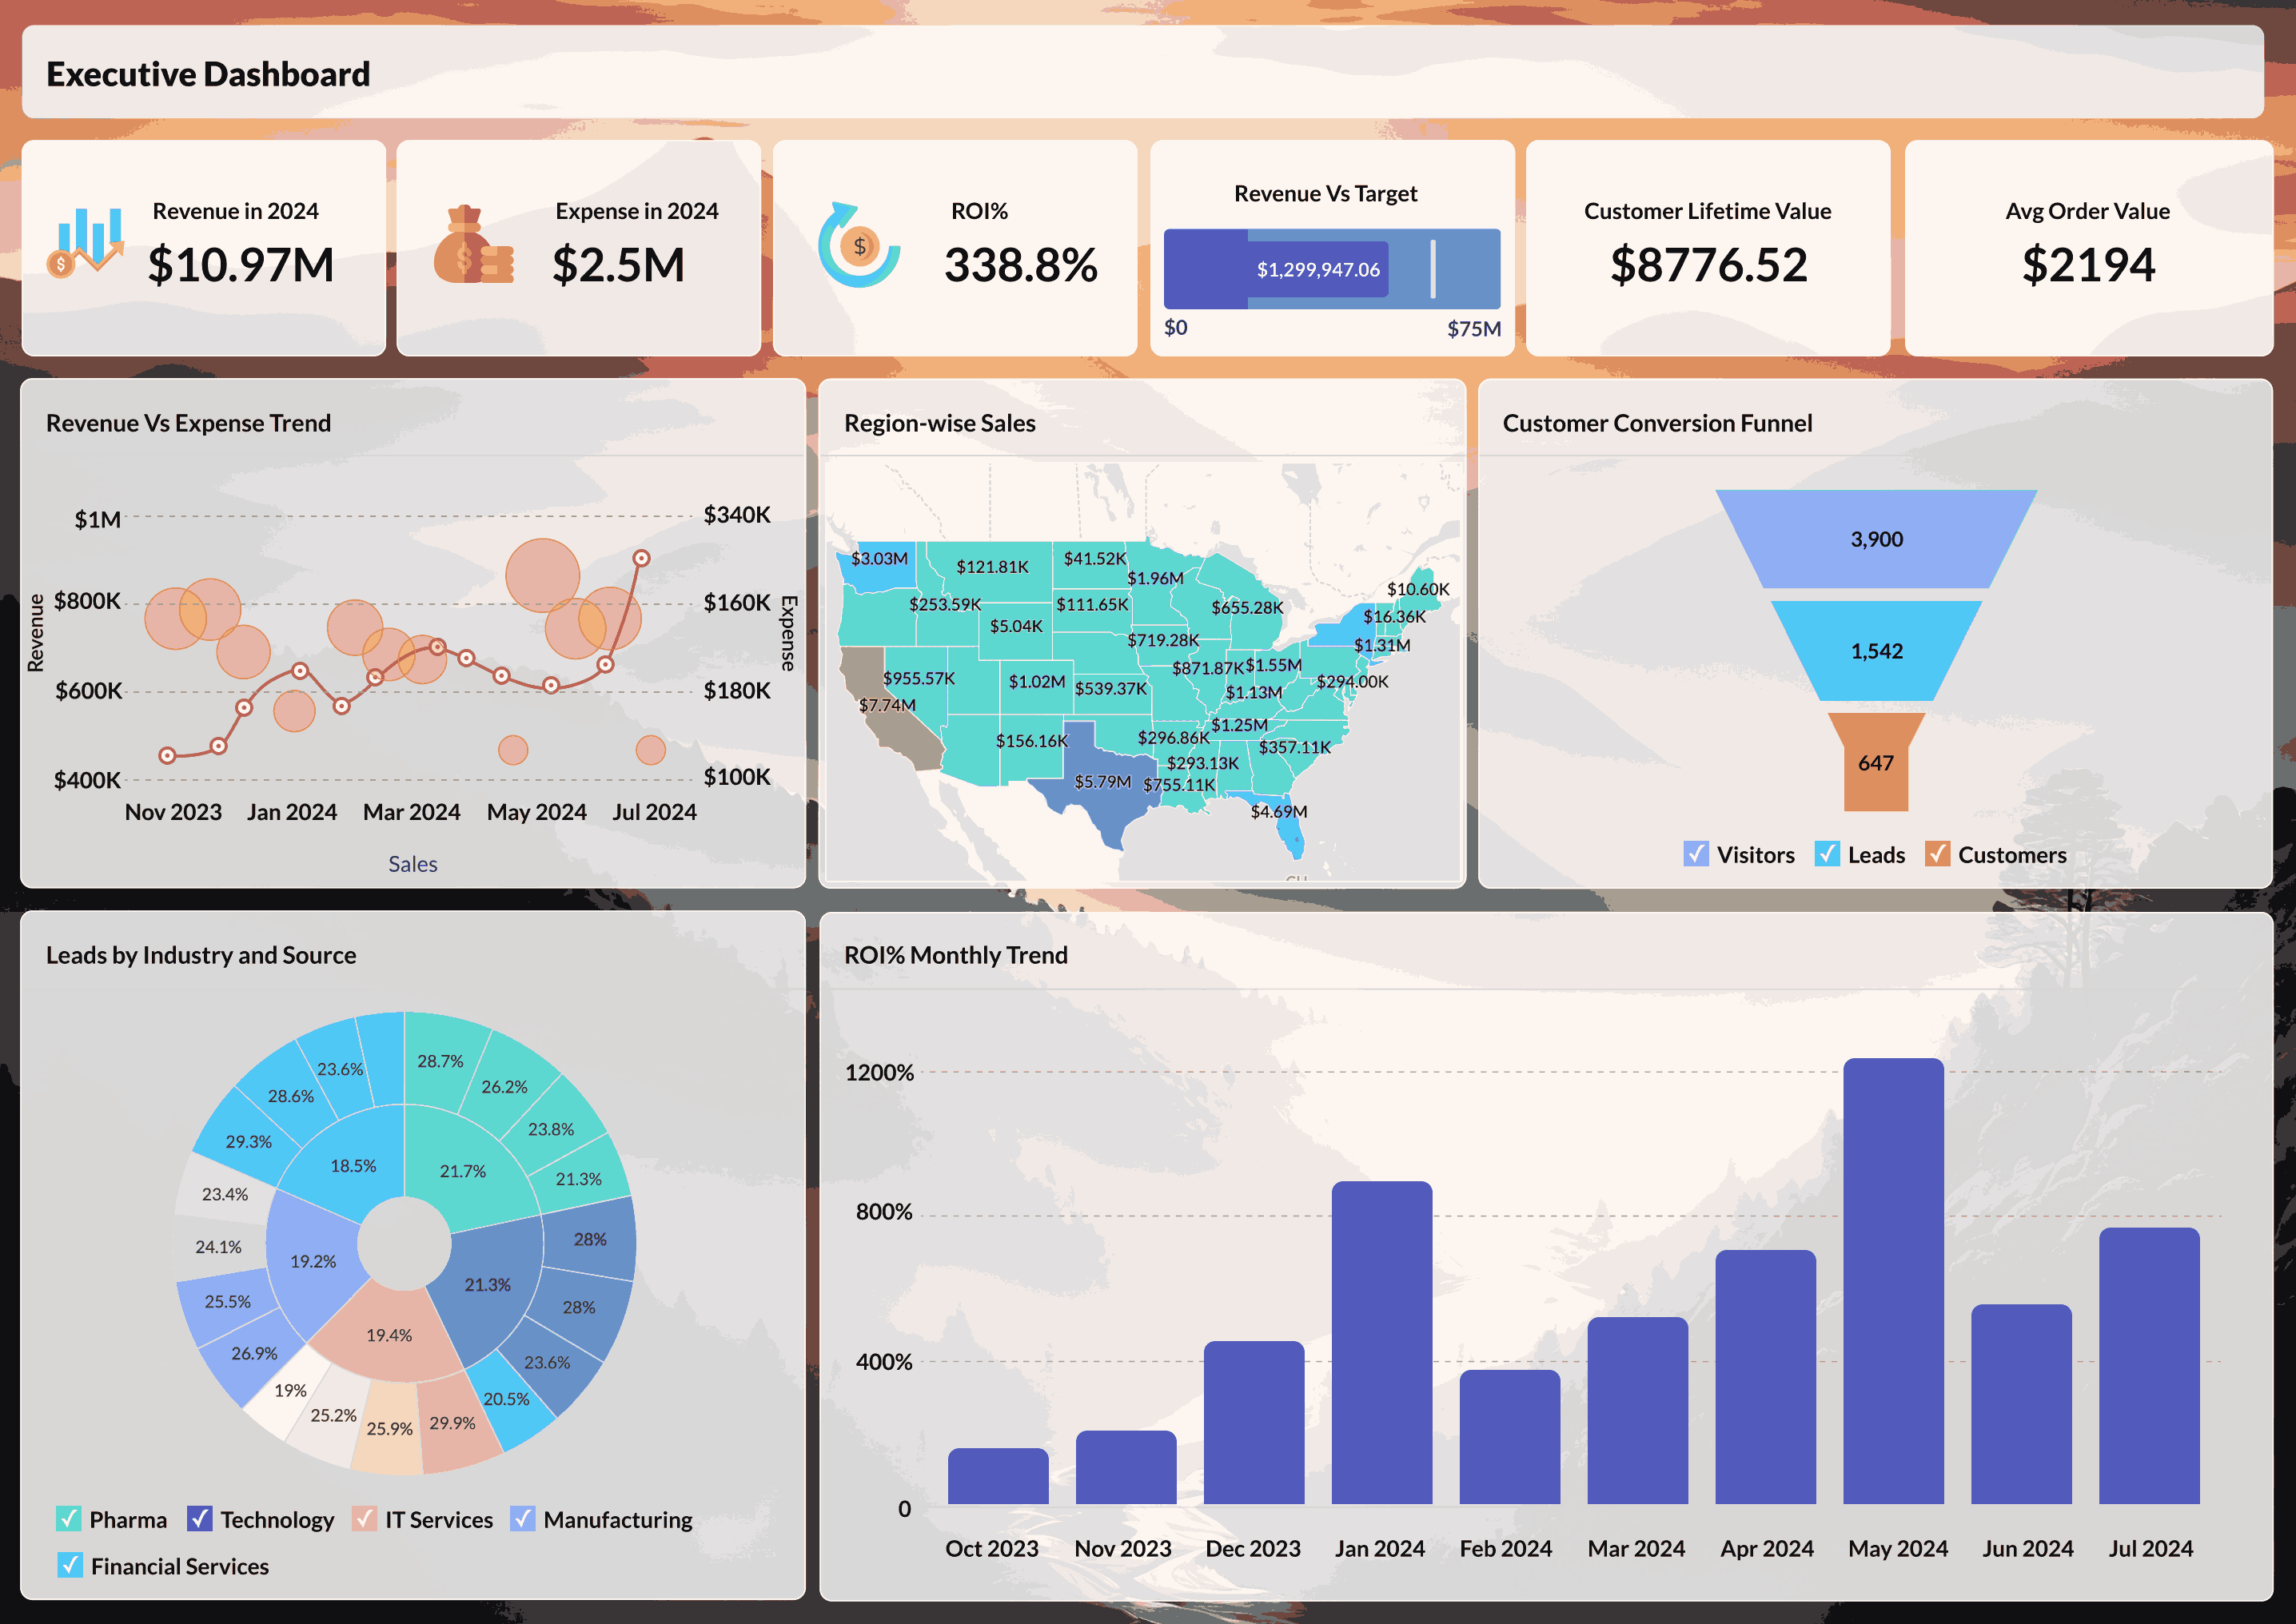
Interactive Dashboards
Embedded dashboards combine reports, KPIs, and visual components into a single reporting interface. Filtering, drill-down paths, bookmarks, and report controls allow people to move between summary and detail views. Some platforms also allow teams to create and modify dashboards without developer involvement.
Embedded Reporting
Reports can be introduced directly into application pages or distributed as components within the product into internal systems.
AI-Powered Analytics
AI functions introduce additional ways to search, interpret, and interact with reports. Examples may include AI-assisted querying, anomaly detection, forecasting, and natural-language interaction. These functions can reduce manual report exploration and support additional ways to retrieve information from reporting systems. (Learn more about AI-powered embedded analytics).
White-Labeling and Brand Control
White-labeling allows reports and dashboards to appear as part of the host product instead of introducing a separate reporting interface. Configuration options may include custom logos, colors, domains, navigation patterns, and UI styling. Platforms may also provide controls that apply branding at dashboard and report levels.
Multi-Tenancy and Access Control
Reporting deployments often require separation between customer accounts and control over who can access specific reports. Common controls include row-level security, SSO authentication, and role-based access settings that determine report visibility across deployments.
Flexible Embedding Options
Platforms often support more than one embedding method so teams can choose an approach that fits their application setup. Common approaches include iFrames, JavaScript SDKs, REST APIs, and component-based embedding that introduce reports directly into the application. (Know more about embed APIs).
How to Implement Embedded Analytics?
Once reporting requirements and platform capabilities are defined, implementation focuses on introducing reports into the product and configuring how they will be managed over time. The exact process varies depending on data volume, access requirements, and the level of customization involved.
Define reporting goals and usage patterns
Start by identifying who needs access to reports, what information they expect to retrieve, and where reporting should appear inside the product. These decisions influence data preparation, report structure, access controls, and embedding choices later in the implementation.
Choose a platform
Compare platforms based on the requirements already identified. Evaluation criteria may include available data connectors, embedding methods, branding options, AI functions, authentication controls, pricing, and how reporting is administered after deployment.
Design the reporting interface
Reports and dashboards should follow the structure and visual language of the host application. Setup options may include branding, navigation, report organization, and access settings so different teams or customer groups receive the reporting views intended for them.
Implement and validate
Introduce reports using the selected embedding method such as iFrames, SDKs, or APIs. Testing should cover report accuracy, refresh behavior, access permissions, performance under expected usage conditions, and consistency across supported interfaces.
Review and maintain
Reporting requirements often change after launch as teams request additional reports, modified layouts, or new data sources. Updates after launch may include report adjustments, data model changes, access updates, and maintenance of embedded reporting behavior.
What Should I Look for in an Embedded Analytics Partner?
An embedded analytics platform affects more than report delivery. The platform you choose influences how data is connected, how reporting is introduced into the product, and how much engineering effort is required to maintain it over time.
Questions to evaluate before selecting a platform:
- Does the platform connect to the data sources your customers already use?
- Do branding controls extend to domains, communication templates, and interface customization?
- How are multi-tenant access and row-level permissions configured?
- What APIs, SDKs, or embedding methods are available?
- Can the reporting setup be tested through a proof-of-concept or sandbox environment?
- What administrative controls are available after deployment?
Support and implementation resources also matter during evaluation. Review the quality of technical documentation, onboarding support, implementation guidance, and response processes for production issues alongside available platform functions.
Zoho Analytics supports embedded reporting across ISV, SaaS, and enterprise deployment scenarios. The platform includes controls for branding, embedding, authentication, and report management across different deployment scenarios.
What Does Embedded Analytics Cost?
Embedded analytics pricing depends on deployment approach, report access patterns, and how usage is measured.
Per-user or per-viewer pricing
Pricing increases based on the number of people who access reports and dashboards. This model appears frequently in SaaS products that include reporting as part of subscription plans.
Usage-based pricing
Pricing depends on factors such as data volume, query activity, or API usage. This approach is often used when reporting activity changes across customers or reporting periods.
Revenue-share or OEM licensing
Pricing is tied to revenue generated through products that include embedded reporting. This model appears in OEM and white-label deployment scenarios.
Server-based or core-based pricing
Pricing is tied to infrastructure allocation rather than report access volume. This model is commonly used for internal embedded deployments with larger user groups.
Zoho Analytics uses usage-based pricing for embedded reporting deployments. Pricing can vary depending on implementation requirements, deployment type, and white-label needs. Contact the Zoho Analytics team for pricing details specific to your deployment. When comparing options, include implementation effort, maintenance requirements, and ongoing administration alongside licensing costs. Teams evaluating build-versus-buy decisions may also compare those costs against maintaining reporting infrastructure internally.
Choose the Right Embedded Analytics Platform: Zoho Analytics
Once reporting requirements and deployment goals are defined, the next step is choosing how reports will be introduced and managed inside the product.
Zoho Analytics supports embedded reporting across ISV, SaaS, and enterprise deployment scenarios with options for branding, access management, and deployment configuration.
Branding and White-Labeling
Zoho Analytics supports branding controls such as logos, colors, domains, typography, and navigation settings. These options allow reports and dashboards to appear as part of the host product rather than introducing a separate reporting interface.
Deployment and Access Controls
Zoho Analytics supports multi-tenant deployments, SSO authentication, row-level permissions, and access controls for customer-facing and internal reporting environments.
Embedding Methods
Zoho Analytics supports embedding through iFrames, JavaScript SDKs, and REST APIs across web, mobile, and desktop environments.
AI Functions for Reporting
Zoho Analytics includes AI functions that support report exploration, forecasting, anomaly identification, and conversational interaction through Zia. (Learn more about AI-powered embedded analytics with Zoho Analytics).
Hear What Our Customers Are Saying

"Since we started working Zoho Analytics, from a macro perspective we have increased sales volume by around 40%, which we largely attribute to the ability to react quickly and correctly to the certain needs of the room and the market."
Ivan CarilloBusiness Intelligence Director, WinlandRead more here"Our sales agents have dashboards and can see their performance, the profit they create per order, and targets for the month. This is crucial for our sales team. This deep analysis was not possible before."
Toni WallDirector of Market Development, The Collins CompaniesRead more hereReady to Embed Analytics In Your Product?
If you're evaluating embedded analytics, explore available embedding options, review deployment approaches, and compare reporting requirements before implementation. Book a demo or request pricing details to evaluate whether Zoho Analytics fits your reporting and deployment needs.
Book your DemoGet a Price QuoteFrequently Asked Questions
How is embedded analytics different from traditional BI?
- Traditional BI tools typically operate as separate reporting environments where people open reports outside the application they use for day-to-day work. Embedded analytics focuses on where reporting appears. Reports, dashboards, and analytical tools are introduced directly inside an existing product instead of being accessed through a separate reporting interface.
How long does it take to implement embedded analytics with Zoho Analytics?
- Implementation time depends on factors such as data preparation, report requirements, branding needs, access setup, and embedding method. Smaller reporting deployments can often be introduced quickly, while deployments that include white-labeling, row-level permissions, multi-tenancy, and deeper application integration may require additional implementation effort.
Can I white-label Zoho Analytics for my product?
- Yes. Zoho Analytics supports white-labeling options including custom logos, color settings, domain mapping, and UI customization. These controls allow reports and dashboards to appear within the visual structure of the host product instead of using the Zoho Analytics interface.
What are the ways to embed data analytics into applications?
- Analytics can be embedded into applications using methods such as iFrames, JavaScript SDKs, REST APIs, or component-based embedding. The implementation approach depends on factors such as customization requirements, access controls, application architecture, and report behavior.
What are the key features of an embedded analytics platform?
- Embedded analytics platforms commonly provide dashboards and reporting, data preparation and modeling, white-labeling controls, multi-tenant access configuration, SSO and authentication support, AI functions for reporting, and embedding through APIs and SDKs. The exact combination depends on deployment needs and reporting goals.
How do you monetize data with embedded analytics?
- Software teams can package reporting as part of subscription plans or introduce additional reporting options for customers with different usage needs. Common approaches include customer-facing dashboards, expanded reporting access, or packaged analytics functionality.
What kind of apps can I embed analytics into?
- Analytics can be introduced into web applications, mobile applications, and desktop software. Zoho Analytics supports embedding through iFrames, JavaScript SDKs, and REST APIs. Common deployment contexts include SaaS products, ERP extensions, customer portals, partner reporting interfaces, and internal business systems.
How does pricing work for embedded deployments?
- Zoho Analytics uses usage-based pricing for embedded reporting deployments. Pricing can vary depending on report access volume, deployment structure, and implementation requirements. Contact the Zoho Analytics team for pricing details related to OEM and white-label deployments.